
Case Study: Valuing a Phase 2 Biotech Asset with Real-World Uncertainty
Context:
A biotech company with a Phase 2 lead asset needed a valuation framework to guide investor discussions and prepare for potential licensing talks. The challenge? No recent market access data, major uncertainty around price and uptake, and a wide range of possible outcomes across the US, EU5, and Japan.
The Problem with Traditional DCFs:
Single-scenario DCFs fall apart in early-stage biotech. Too many unknowns. Too much noise disguised as precision. At best, they oversimplify risk; at worst, they send the wrong signal to investors and partners.
Our Solution:
We used a stochastic DCF framework to model the full distribution of potential outcomes — not just a point estimate.
- We worked with the company’s team and KOLs to define assumptions around price, uptake, gross margin, and probability of success.
- Each variable was translated into aprobability distribution — using minimal-bias principles (think entropy, but without the academic detour).
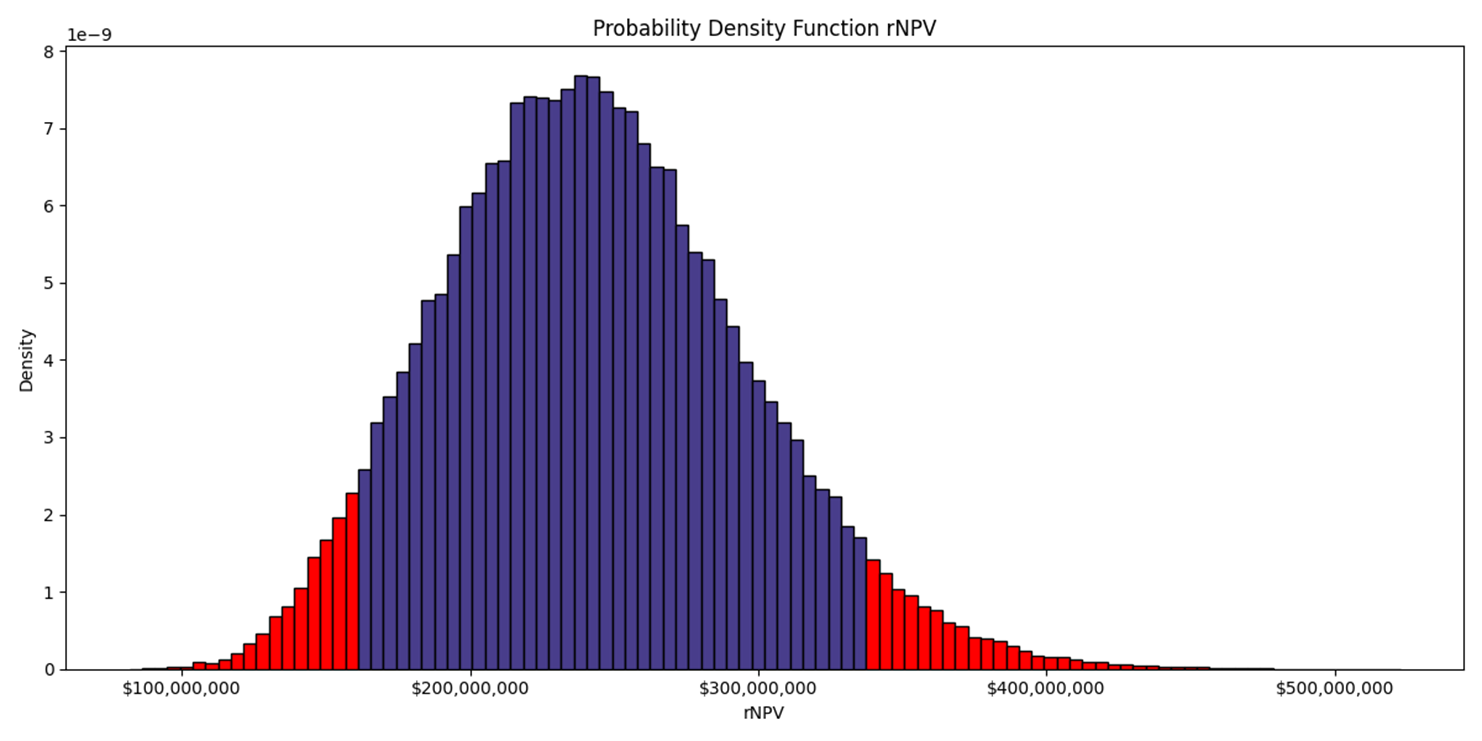
- We then ran aMonte Carlo simulation, generating thousands of rNPV outcomes to reflect the true range of possible futures.
What the Model Shows:
The output isn’t “the number” — it’s the distribution. In this case, a lognormal-shaped curve with a 90% confidence interval from ~$X to ~$Y as shown in figure below (purple coloured area). Importantly, the right tail reveals meaningful upside — exactly the kind of outlier return profile VCs and pharma partners are betting on.
Why It Matters:
- It aligns with how sophisticated investors and pharma assess risk.
They think in probabilities and portfolios, not fixed numbers. - It sharpens your narrative.
You’re not selling a guarantee — you’re offering a chance at something big. The right tail is where deals are made. - It evolves with your data.
As clinical results emerge, this model becomes even more useful — narrowing uncertainty, updating valuation, and informing go/no-go decisions.
Bottom Line:
In biotech, most decisions are irreversible, and most outcomes are uncertain. We help clients build valuation frameworks that are realistic, resilient, and relevant — not just to investors, but to partners making multi-hundred-million-dollar bets.
License or Build? Using Decision Tree Analysis to Guide Strategic Pathways
Client Context
An early-clinical stage biotech company with a lead asset approaching Phase 1 needed to evaluate whether to license the asset early or invest further and build value through development. With limited clinical data and evolving program design, the company needed a way to assess not just potential value — but also when and how to create and capture it.
The Strategic Challenge
Standard rNPV or DCF models fall short in early-stage biotech. They assume fixed paths and ignore how real decisions unfold across development. In this case, the company needed to:
- Identify valueinflection points in the development journey
- Assess thecost and risk of pushing beyond Phase 2
- Determine whether tolicense early or retain optionality for a larger exit later
Our Approach: Decision Tree Analysis (DTA)
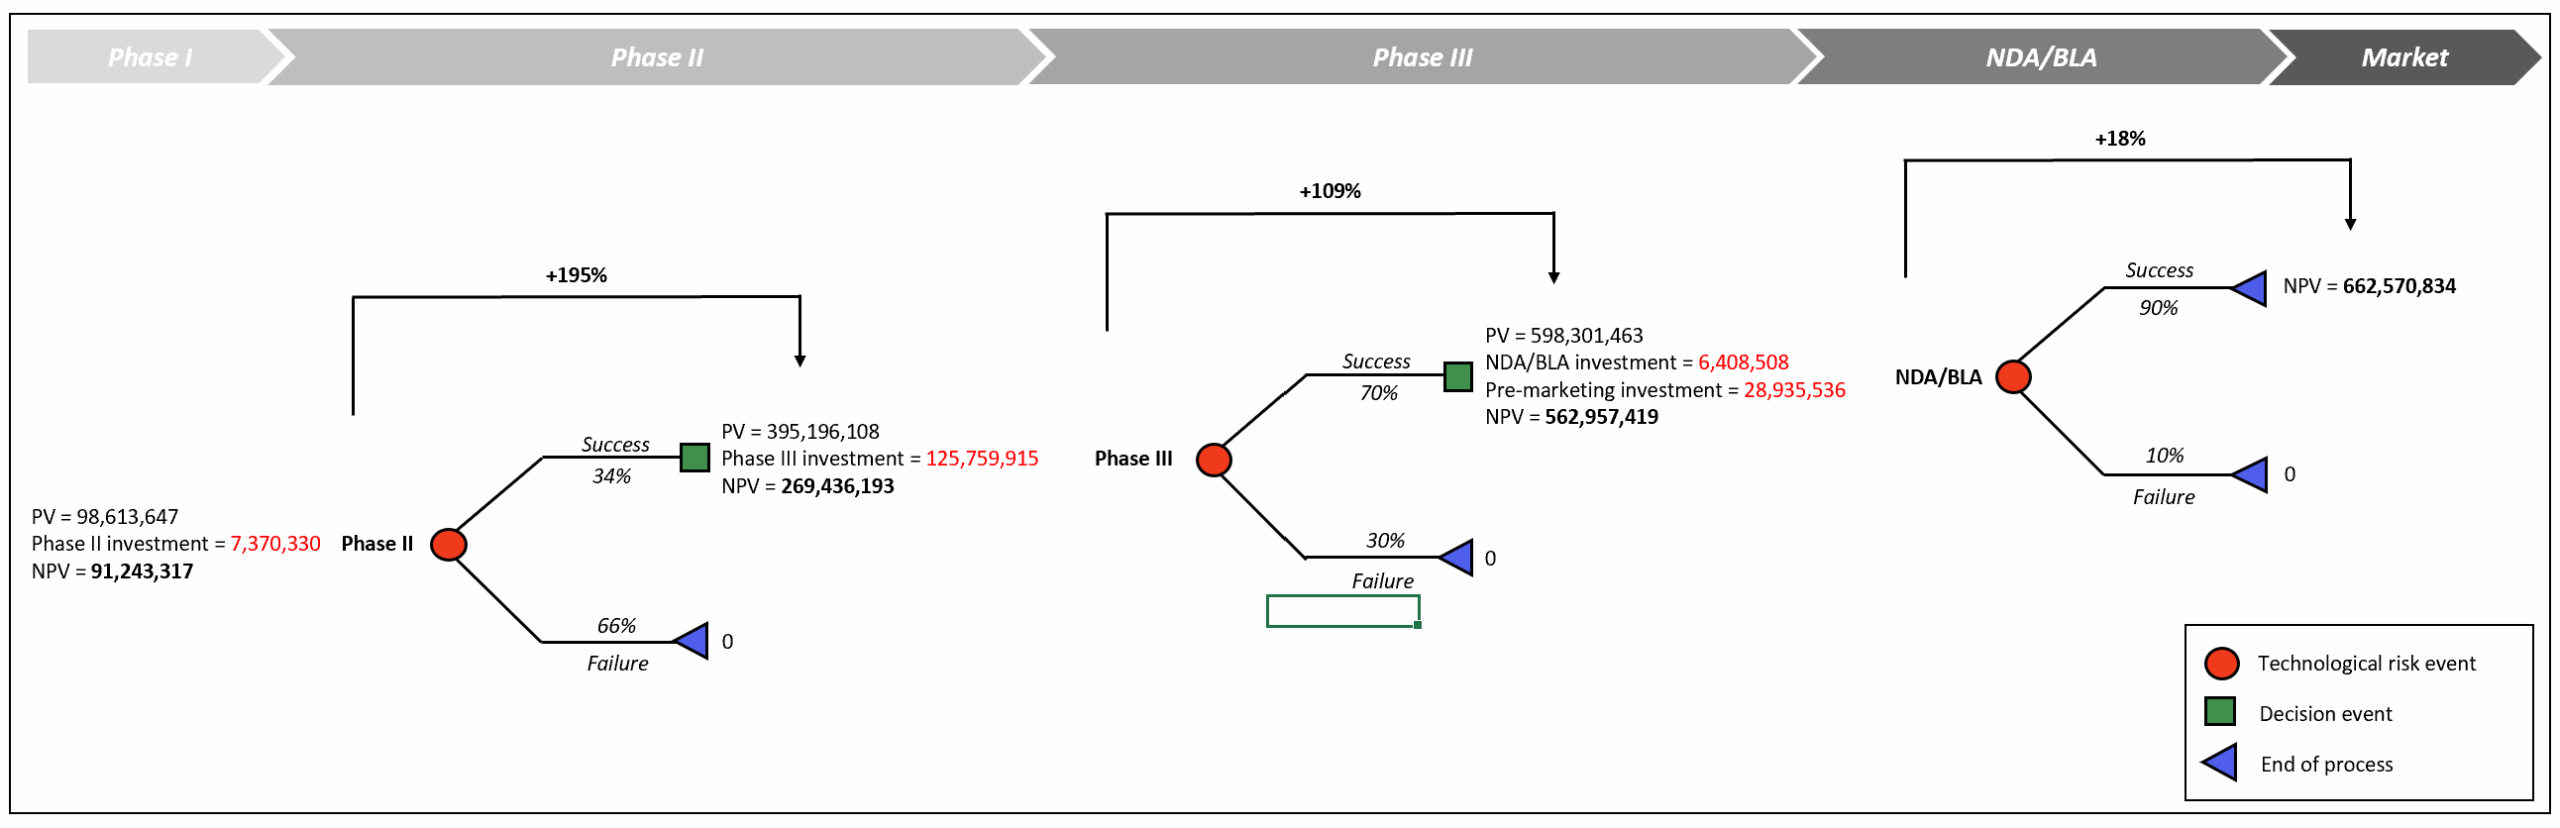
We used Decision Tree Analysis to explicitly model the sequence of decisions and potential outcomes across the clinical path. At each development stage — from Phase 1 to NDA — we mapped:
- Probabilities of technical success
- Investment required to proceed
- Estimated future NPVat each decision node
- Option to stop, license, or continue building
This allowed the client to visualize how flexibility, risk, and capital interact — and where licensing could deliver acceptable value versus when building might justify the added risk.
Key Insight: Optionality Has Real Value — But Only If You Can Afford to Exercise It
The model revealed a sharp value jump from Phase IIb to Phase 3. However, the cost of reaching and executing Phase 3 introduced major financial risk. Without clear visibility into crossover-stage funding or strategic partners, the team risked owning an asset they couldn’t afford to unlock.
Implications for Pharma BD and Licensing Strategy
- Clear deal timing signals: The model helped frame discussions around licensingpost-Phase 2, where value was clearly defined and de-risked, but before heavy Phase 3 costs.
- Structured deal potential: The decision tree allowed pharma BD teams to evaluate co-development or staged buyout options, aligned with value creation points.
- Build vs. license discipline: Internally, the tool served as a reality check: value creation only matters if you can fund it.
Why Decision Trees?
We chose DTA over complex real option(ROV) models because:
- It captures the same logic (value of flexibility)
- It’s transparent, intuitive, and easy to share across internal and external stakeholders
- As McKinsey has argued:
“If technological risks — such as drug trial outcomes — are critical to future investment decisions, the underlying risk is diversifiable, and both ROV and DTA are effective tools for valuing flexibility. Using DTA, it is possible to discount project payoffs at the cost of capital of the underlying asset and investment requirements at the risk-free rate.”
In other words: DTA gives us the same economic insight as a binomial options model, but with fewer assumptions and better interpretability — especially when communicating with internal stakeholders and external partners.